Matplotlib
Matplotlib is a low level graph plotting library in python that serves as a visualization utility.
Matplotlib was created by John D. Hunter. Matplotlib is open source and we can use it freely.
Matplotlib is mostly written in python, a few segments are written in C, Objective-C and Javascript for Platform compatibility.

Matplotlib
m
- Installation of Matplotlib
pip install matplotlib - Import Matplotlib
import matplotlib - Checking Matplotlib Version
import matplotlibprint(matplotlib.__version__) -
Matplotlib Pyplot
Matplotlib Pyplot
Pyplot
Most of the Matplotlib utilities lies under the pyplot submodule, and are usually imported under the plt alias
Now the Pyplot package can be referred to as plt.
Plotting x and y points
The plot() function is used to draw points (markers) in a diagram.
By default, the plot() function draws a line from point to point.
The function takes parameters for specifying points in the diagram.
Parameter 1 is an array containing the points on the x-axis.
Parameter 2 is an array containing the points on the y-axis.
The x-axis is the horizontal axis.
The y-axis is the vertical axis.
Plotting Without Line
To plot only the markers, you can use shortcut string notation parameter 'o', which means 'rings'.import matplotlib.pyplot as pltxpoints = np.array([1, 8]) ypoints = np.array([3, 10]) plt.plot(xpoints, ypoints) plt.show()
                                    xpoints = np.array([1, 8])
                                    ypoints = np.array([3, 10])

                                    plt.plot(xpoints, ypoints, 'o')
                                    plt.show()
                                    xpoints = np.array([1, 2, 6, 8])
                                    ypoints = np.array([3, 8, 1, 10])

                                    plt.plot(xpoints, ypoints)
                                    plt.show()
                                    ypoints = np.array([3, 8, 1, 10, 5, 7])plt.plot(ypoints)
plt.show()
- Matplotlib Markers
Matplotlib Markers
Markers
You can use the keyword argument marker to emphasize each point with a specified marker
Marker Reference
Marker Description 'o' Circle '*' Star '.' Point ',' Pixel 'x' X 'X' X (filled) '+' Plus 'P' Plus (filled) 's' Square 'D' Diamond 'd' Diamond (thin) 'p' Pentagon 'H' Hexagon 'h' Hexagon 'v' Triangle Down '^' Triangle Up '<' Triangle Left '>' Triangle Right '1' Tri Down '2' Tri Up '3' Tri Left '4' Tri Right '|' Vline '_' Hline - Line Reference
Line Reference
Line Syntax Description '-' Solid line ':' Dotted line '--' Dashed line '-.' Dashed/dotted line - Color Reference
Color Reference
Color Syntax Description 'r' Red 'g' Green 'b' Blue 'c' Cyan 'm' Magenta 'y' Yellow 'k' Black 'w' White - Marker Size
Marker Size
Marker Size
You can use the keyword argument markersize or the shorter version, ms to set the size of the markers
                        ypoints = np.array([3, 8, 1, 10])                        plt.plot(ypoints, marker = 'o', ms = 20)
                        plt.show()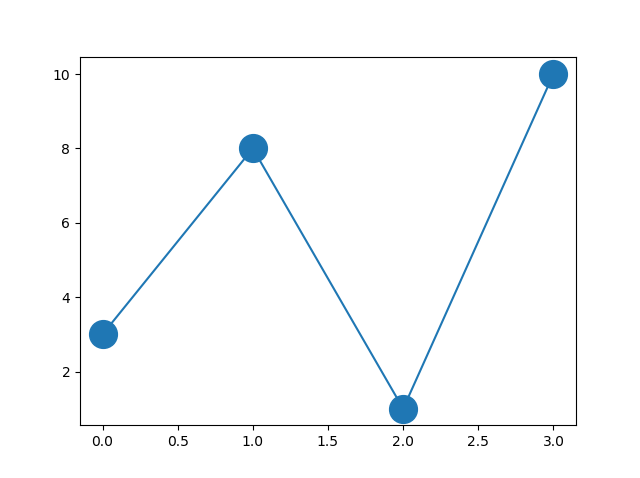
- Line Color
Line Color
Line Color
You can use the keyword argument color or the shorter c to set the color of the lineypoints = np.array([3, 8, 1, 10]) plt.plot(ypoints, color = 'r') plt.show()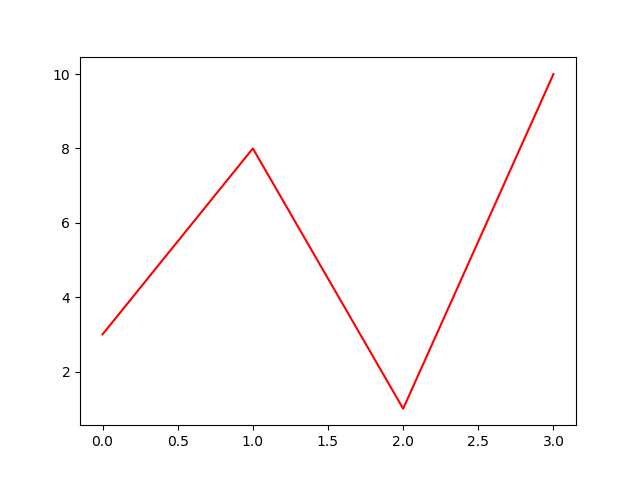
- Line Width
Line Width
You can use the keyword argument linewidth or the shorter lw to change the width of the line.
The value is a floating number, in pointsypoints = np.array([3, 8, 1, 10]) plt.plot(ypoints, linewidth = '20.5') plt.show()
- Linestyle
Linestyle
You can use the keyword argument linestyle, or shorter ls, to change the style of the plotted line
Shorter Syntax:
The line style can be written in a shorter syntax:
linestyle can be written as ls.ypoints = np.array([3, 8, 1, 10])plt.plot(ypoints, linestyle = 'dotted') plt.show()plt.plot(ypoints, ls = ':')
- Marker Size
Marker Size
Marker Size
You can use the keyword argument markersize or the shorter version, ms to set the size of the markers
                        ypoints = np.array([3, 8, 1, 10])                        plt.plot(ypoints, marker = 'o', ms = 20)
                        plt.show()
- Marker Color
Marker Color
Marker Color
You can use the keyword argument markeredgecolor or the shorter mec to set the color of the edge of the markers
You can use the keyword argument markerfacecolor or the shorter mfc to set the color inside the edge of the markersypoints = np.array([3, 8, 1, 10])plt.plot(ypoints, marker = 'o', ms = 20, mec = 'r') plt.show()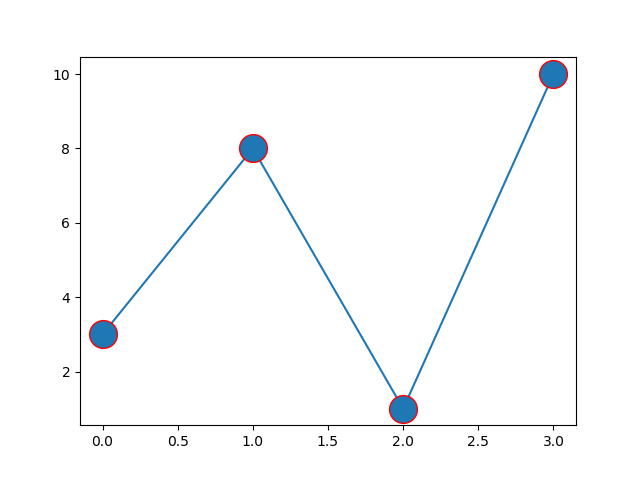
        ypoints = np.array([3, 8, 1, 10])        plt.plot(ypoints, marker = 'o', ms = 20, mfc = 'r')
        plt.show()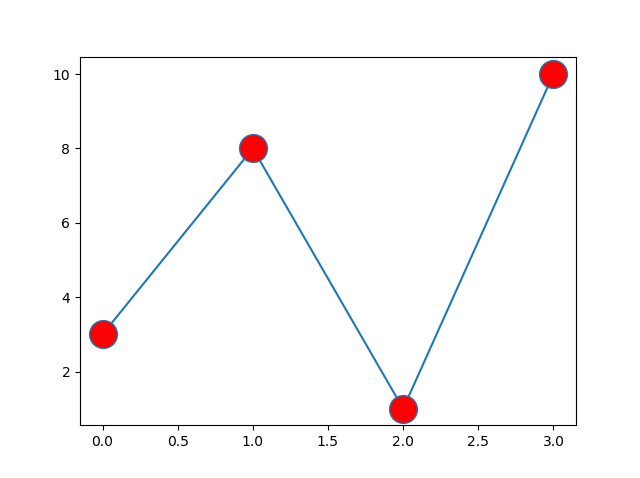
- Format Strings fmt
Format Strings fmt
Format Strings fmt
You can use also use the shortcut string notation parameter to specify the marker.
This parameter is also called fmt, and is written with this syntax:
marker|line|color
plt.title(" ")
plt.xlabel(" ")
plt.ylabel(" ")
font1 = {'family':'serif','color':'blue','size':20}
font2 = {'family':'serif','color':'darkred','size':15}
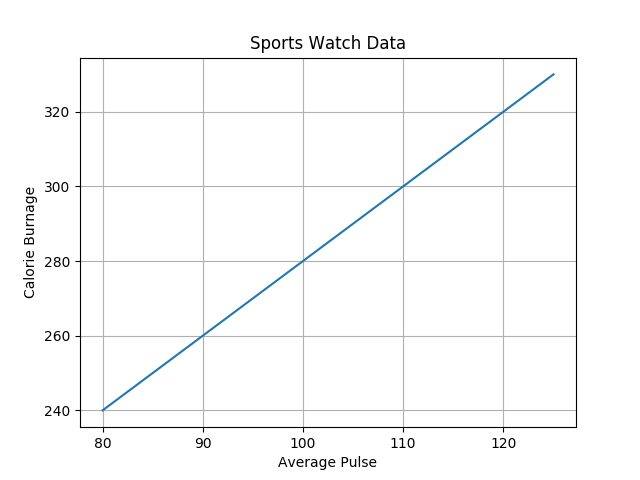
plt.title("Sports Watch Data", fontdict = font1)
plt.xlabel("Average Pulse", fontdict = font2)
plt.ylabel("Calorie Burnage", fontdict = font2)

                                    arr = np.array([1, 2, 3, 4, 5])
                                    x = arr.copy()
Legal values are: 'left', 'right', and 'center'. Default value is 'center'.
plt.title("Data", loc = 'left')
plt.grid()
                                    x = np.array([0, 1, 2, 3])
y = np.array([3, 8, 1, 10])plt.subplot(1, 2, 1)
plt.plot(x,y)#plot 2:
x = np.array([0, 1, 2, 3])
y = np.array([10, 20, 30, 40])plt.subplot(1, 2, 2)
plt.plot(x,y)plt.show()

plt.subplot(1, 2, 1) #the figure has 1 row, 2 columns, and this plot is the first plot.
plt.subplot(1, 2, 2) #the figure has 1 row, 2 columns, and this plot is the second plot.
plt.title("SALES")
plt.suptitle("MY SHOP")
x = np.array([5,7,8,7,2,17,2,9,4,11,12,9,6])
y = np.array([99,86,87,88,111,86,103,87,94,78,77,85,86])

                                    plt.scatter(x, y)
                                    plt.show()

Note: You cannot use the color argument for this, only the c argument.
 x = np.array([5,7,8,7,2,17,2,9,4,11,12,9,6])
y = np.array([99,86,87,88,111,86,103,87,94,78,77,85,86])
colors = np.array(["red","green","blue","yellow","pink","black","orange","purple","beige","brown","gray","cyan","magenta"])

                                    plt.scatter(x, y, c=colors)

                                    plt.show()

                                The Matplotlib module has a number of available colormaps.                                    A colormap is like a list of colors, where each color has a value that ranges from 0 to 100.

                                    x = np.array([5,7,8,7,2,17,2,9,4,11,12,9,6])
                                    y = np.array([99,86,87,88,111,86,103,87,94,78,77,85,86])
                                    colors = np.array([0, 10, 20, 30, 40, 45, 50, 55, 60, 70, 80, 90, 100])

                                    plt.scatter(x, y, c=colors, cmap='viridis')

                                    plt.show()
plt.colorbar()

| Name | Reverse | |||
|---|---|---|---|---|
| Accent | Try it » | Accent_r | Try it » | |
| Blues | Try it » | Blues_r | Try it » | |
| BrBG | Try it » | BrBG_r | Try it » | |
| BuGn | Try it » | BuGn_r | Try it » | |
| BuPu | Try it » | BuPu_r | Try it » | |
| CMRmap | Try it » | CMRmap_r | Try it » | |
| Dark2 | Try it » | Dark2_r | Try it » | |
| GnBu | Try it » | GnBu_r | Try it » | |
| Greens | Try it » | Greens_r | Try it » | |
| Greys | Try it » | Greys_r | Try it » | |
| OrRd | Try it » | OrRd_r | Try it » | |
| Oranges | Try it » | Oranges_r | Try it » | |
| PRGn | Try it » | PRGn_r | Try it » | |
| Paired | Try it » | Paired_r | Try it » | |
| Pastel1 | Try it » | Pastel1_r | Try it » | |
| Pastel2 | Try it » | Pastel2_r | Try it » | |
| PiYG | Try it » | PiYG_r | Try it » | |
| PuBu | Try it » | PuBu_r | Try it » | |
| PuBuGn | Try it » | PuBuGn_r | Try it » | |
| PuOr | Try it » | PuOr_r | Try it » | |
| PuRd | Try it » | PuRd_r | Try it » | |
| Purples | Try it » | Purples_r | Try it » | |
| RdBu | Try it » | RdBu_r | Try it » | |
| RdGy | Try it » | RdGy_r | Try it » | |
| RdPu | Try it » | RdPu_r | Try it » | |
| RdYlBu | Try it » | RdYlBu_r | Try it » | |
| RdYlGn | Try it » | RdYlGn_r | Try it » | |
| Reds | Try it » | Reds_r | Try it » | |
| Set1 | Try it » | Set1_r | Try it » | |
| Set2 | Try it » | Set2_r | Try it » | |
| Set3 | Try it » | Set3_r | Try it » | |
| Spectral | Try it » | Spectral_r | Try it » | |
| Wistia | Try it » | Wistia_r | Try it » | |
| YlGn | Try it » | YlGn_r | Try it » | |
| YlGnBu | Try it » | YlGnBu_r | Try it » | |
| YlOrBr | Try it » | YlOrBr_r | Try it » | |
| YlOrRd | Try it » | YlOrRd_r | Try it » | |
| afmhot | Try it » | afmhot_r | Try it » | |
| autumn | Try it » | autumn_r | Try it » | |
| binary | Try it » | binary_r | Try it » | |
| bone | Try it » | bone_r | Try it » | |
| brg | Try it » | brg_r | Try it » | |
| bwr | Try it » | bwr_r | Try it » | |
| cividis | Try it » | cividis_r | Try it » | |
| cool | Try it » | cool_r | Try it » | |
| coolwarm | Try it » | coolwarm_r | Try it » | |
| copper | Try it » | copper_r | Try it » | |
| cubehelix | Try it » | cubehelix_r | Try it » | |
| flag | Try it » | flag_r | Try it » | |
| gist_earth | Try it » | gist_earth_r | Try it » | |
| gist_gray | Try it » | gist_gray_r | Try it » | |
| gist_heat | Try it » | gist_heat_r | Try it » | |
| gist_ncar | Try it » | gist_ncar_r | Try it » | |
| gist_rainbow | Try it » | gist_rainbow_r | Try it » | |
| gist_stern | Try it » | gist_stern_r | Try it » | |
| gist_yarg | Try it » | gist_yarg_r | Try it » | |
| gnuplot | Try it » | gnuplot_r | Try it » | |
| gnuplot2 | Try it » | gnuplot2_r | Try it » | |
| gray | Try it » | gray_r | Try it » | |
| hot | Try it » | hot_r | Try it » | |
| hsv | Try it » | hsv_r | Try it » | |
| inferno | Try it » | inferno_r | Try it » | |
| jet | Try it » | jet_r | Try it » | |
| magma | Try it » | magma_r | Try it » | |
| nipy_spectral | Try it » | nipy_spectral_r | Try it » | |
| ocean | Try it » | ocean_r | Try it » | |
| pink | Try it » | pink_r | Try it » | |
| plasma | Try it » | plasma_r | Try it » | |
| prism | Try it » | prism_r | Try it » | |
| rainbow | Try it » | rainbow_r | Try it » | |
| seismic | Try it » | seismic_r | Try it » | |
| spring | Try it » | spring_r | Try it » | |
| summer | Try it » | summer_r | Try it » | |
| tab10 | Try it » | tab10_r | Try it » | |
| tab20 | Try it » | tab20_r | Try it » | |
| tab20b | Try it » | tab20b_r | Try it » | |
| tab20c | Try it » | tab20c_r | Try it » | |
| terrain | Try it » | terrain_r | Try it » | |
| twilight | Try it » | twilight_r | Try it » | |
| twilight_shifted | Try it » | twilight_shifted_r | Try it » | |
| viridis | Try it » | viridis_r | Try it » | |
| winter | Try it » | winter_r | Try it » |
You can adjust the transparency of the dots with the alpha argument.
plt.scatter(x, y, s=sizes, alpha=0.5)
You can change the size of the dots with the s argument.
x = np.array([5,7,8,7,2,17,2,9,4,11,12,9,6])
y = np.array([99,86,87,88,111,86,103,87,94,78,77,85,86])
sizes = np.array([20,50,100,200,500,1000,60,90,10,300,600,800,75])plt.scatter(x, y, s=sizes)
                    x = np.array(["A", "B", "C", "D"])
                    y = np.array([3, 8, 1, 10])

                    plt.bar(x,y)
                    plt.show()

                    x = np.array(["A", "B", "C", "D"])
y = np.array([3, 8, 1, 10])plt.barh(x, y)
plt.show()
                    from members.models import Member
x = Member.objects.all()[0]
x.phone = 5551234
x.joined_date = '2022-01-05'
x.save()

plt.bar(x, y, width = 0.1)
                x = np.random.normal(170, 10, 250)                plt.hist(x)
                plt.show()

                                            y = np.array([35, 25, 25, 15])                                            plt.pie(y)
                                            plt.show()

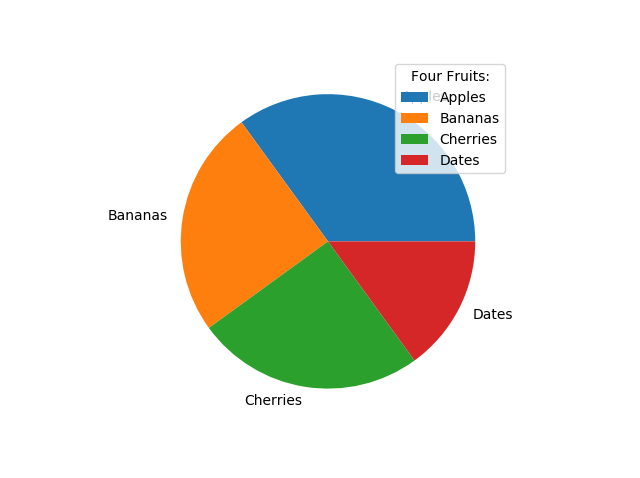
                                            y = np.array([35, 25, 25, 15])
                                            mylabels = ["Apples", "Bananas", "Cherries", "Dates"]

                                            plt.pie(y, labels = mylabels)
                                            plt.show()

                                        y = np.array([35, 25, 25, 15])
                                        mylabels = ["Apples", "Bananas", "Cherries", "Dates"]

                                        plt.pie(y, labels = mylabels, startangle = 90)
                                        plt.show()

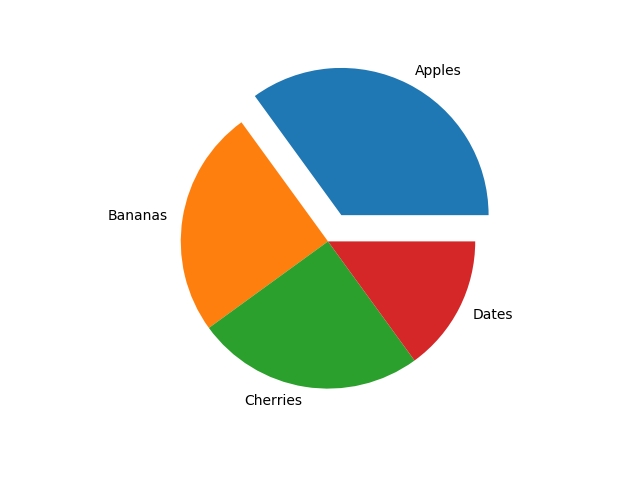
                                    y = np.array([35, 25, 25, 15])
                                    mylabels = ["Apples", "Bananas", "Cherries", "Dates"]
                                    myexplode = [0.2, 0, 0, 0]

                                    plt.pie(y, labels = mylabels, explode = myexplode)
                                    plt.show()
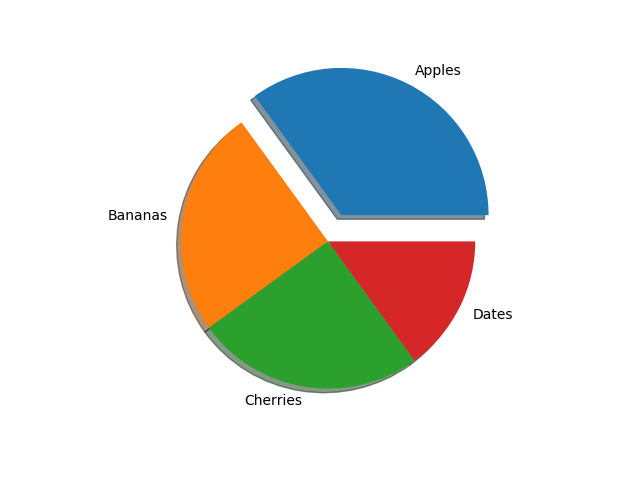
plt.pie(y, labels = mylabels, explode = myexplode, shadow = True)
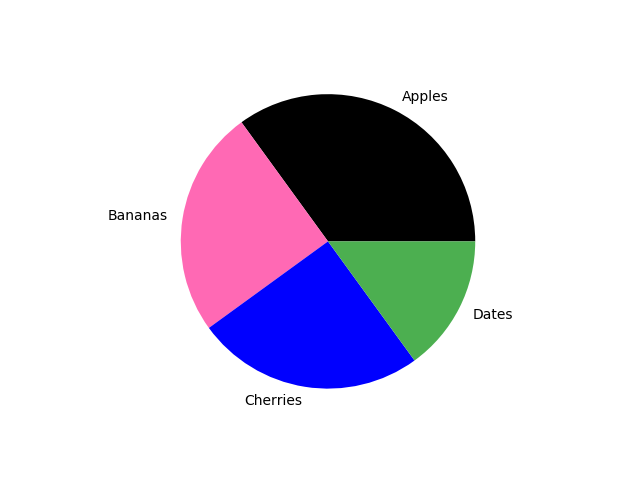
                                        y = np.array([35, 25, 25, 15])
mylabels = ["Apples", "Bananas", "Cherries", "Dates"]
mycolors = ["black", "hotpink", "b", "#4CAF50"]plt.pie(y, labels = mylabels, colors = mycolors)
plt.show()
admin.py
plt.legend()
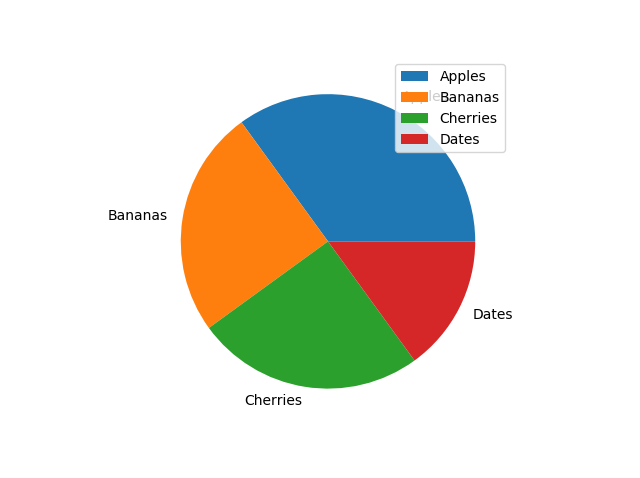
plt.legend(title = "Four Fruits:")